HyperMon

Satellite carrier detection
Illustrates automatic detection, extraction and analysis of carriers (with an 8PSK TDM carrier selected here, its constellation and its cyclo features). Also shows two pairs of cursors for manual measurements, and the frequency range of the underlying Intelsat transponder (blue area at PSD bottom).

Carrier details
Illustrates detailed information gathered by HyperMon when the analysis is fully completed (shown here for a TDM and a SCPC carrier). Also illustrates the filter proposed by HyperMon, that the user can modify if needed.
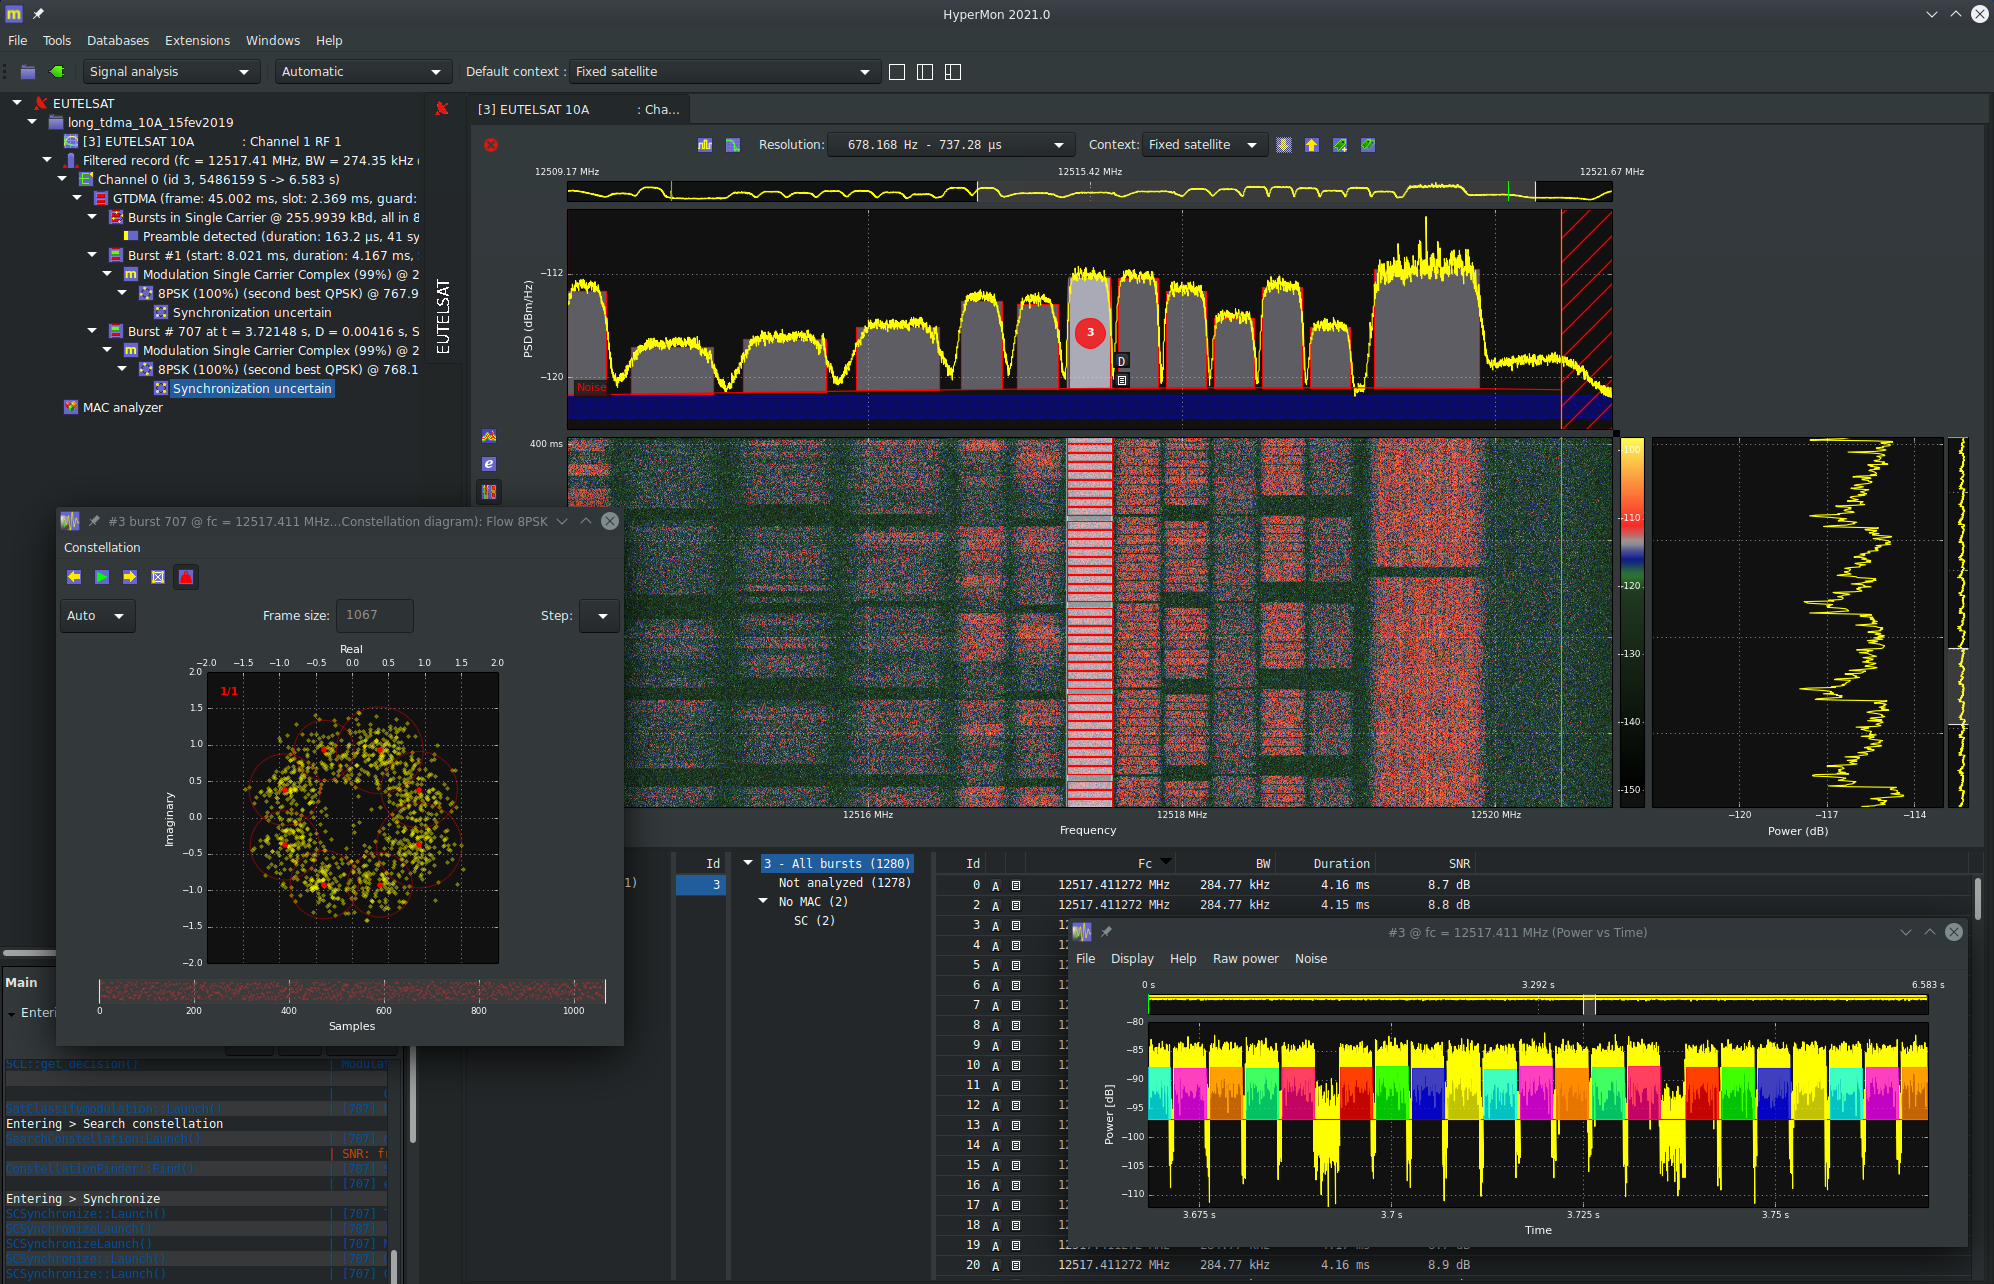
Analysis of Multiple Access Control
Detection an analysis of GTDMA carriers with blind superframe estimation and burst extraction.
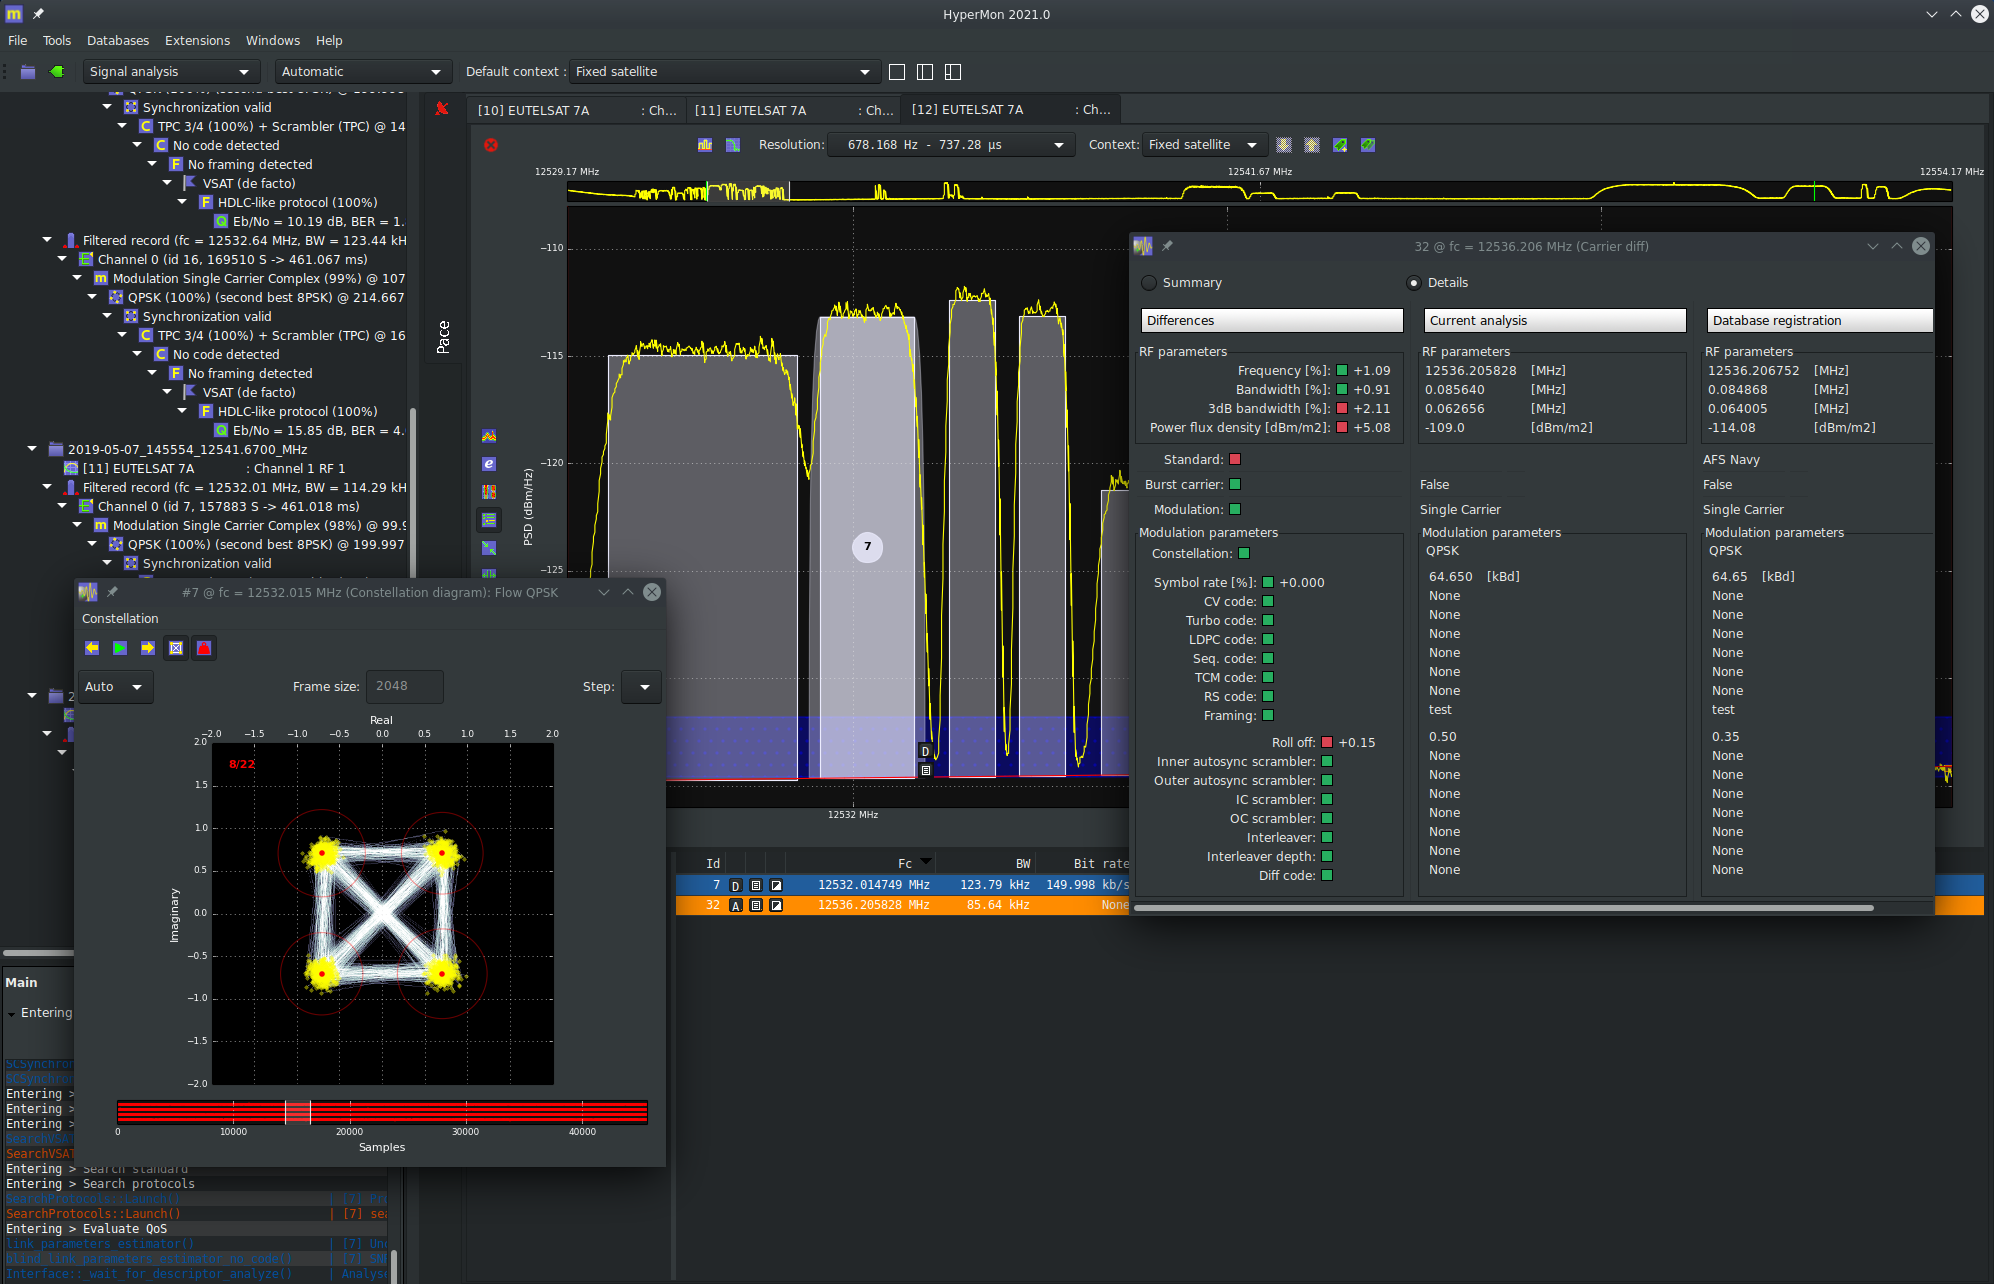
Carrier diff tool
Illustrates the use of database to detect changes in carrier parameters as compared to a previous registration
![Carrier detection in HF - Illustrates detection and analysis of FSK carriers in HF band [3 - 30 MHz]. The detection probability window shows the panel of modulations addressed by the bulit-in classifier. A BPSK is also detected and HyperMon displays the eye diagram.](/image/screenshots/HyperMon/hf_analysis.png)
Carrier detection in HF
Illustrates detection and analysis of FSK carriers in HF band [3 - 30 MHz]. The detection probability window shows the panel of modulations addressed by the bulit-in classifier. A BPSK is also detected and HyperMon displays the eye diagram.

Automatic blind equalization
Modulation and constellation detection over time fading and selective channel using fractionnaly spaced DF-MMA on an 8PSK modulation (upper right) compared to no equalization (AGC only at bottom left).
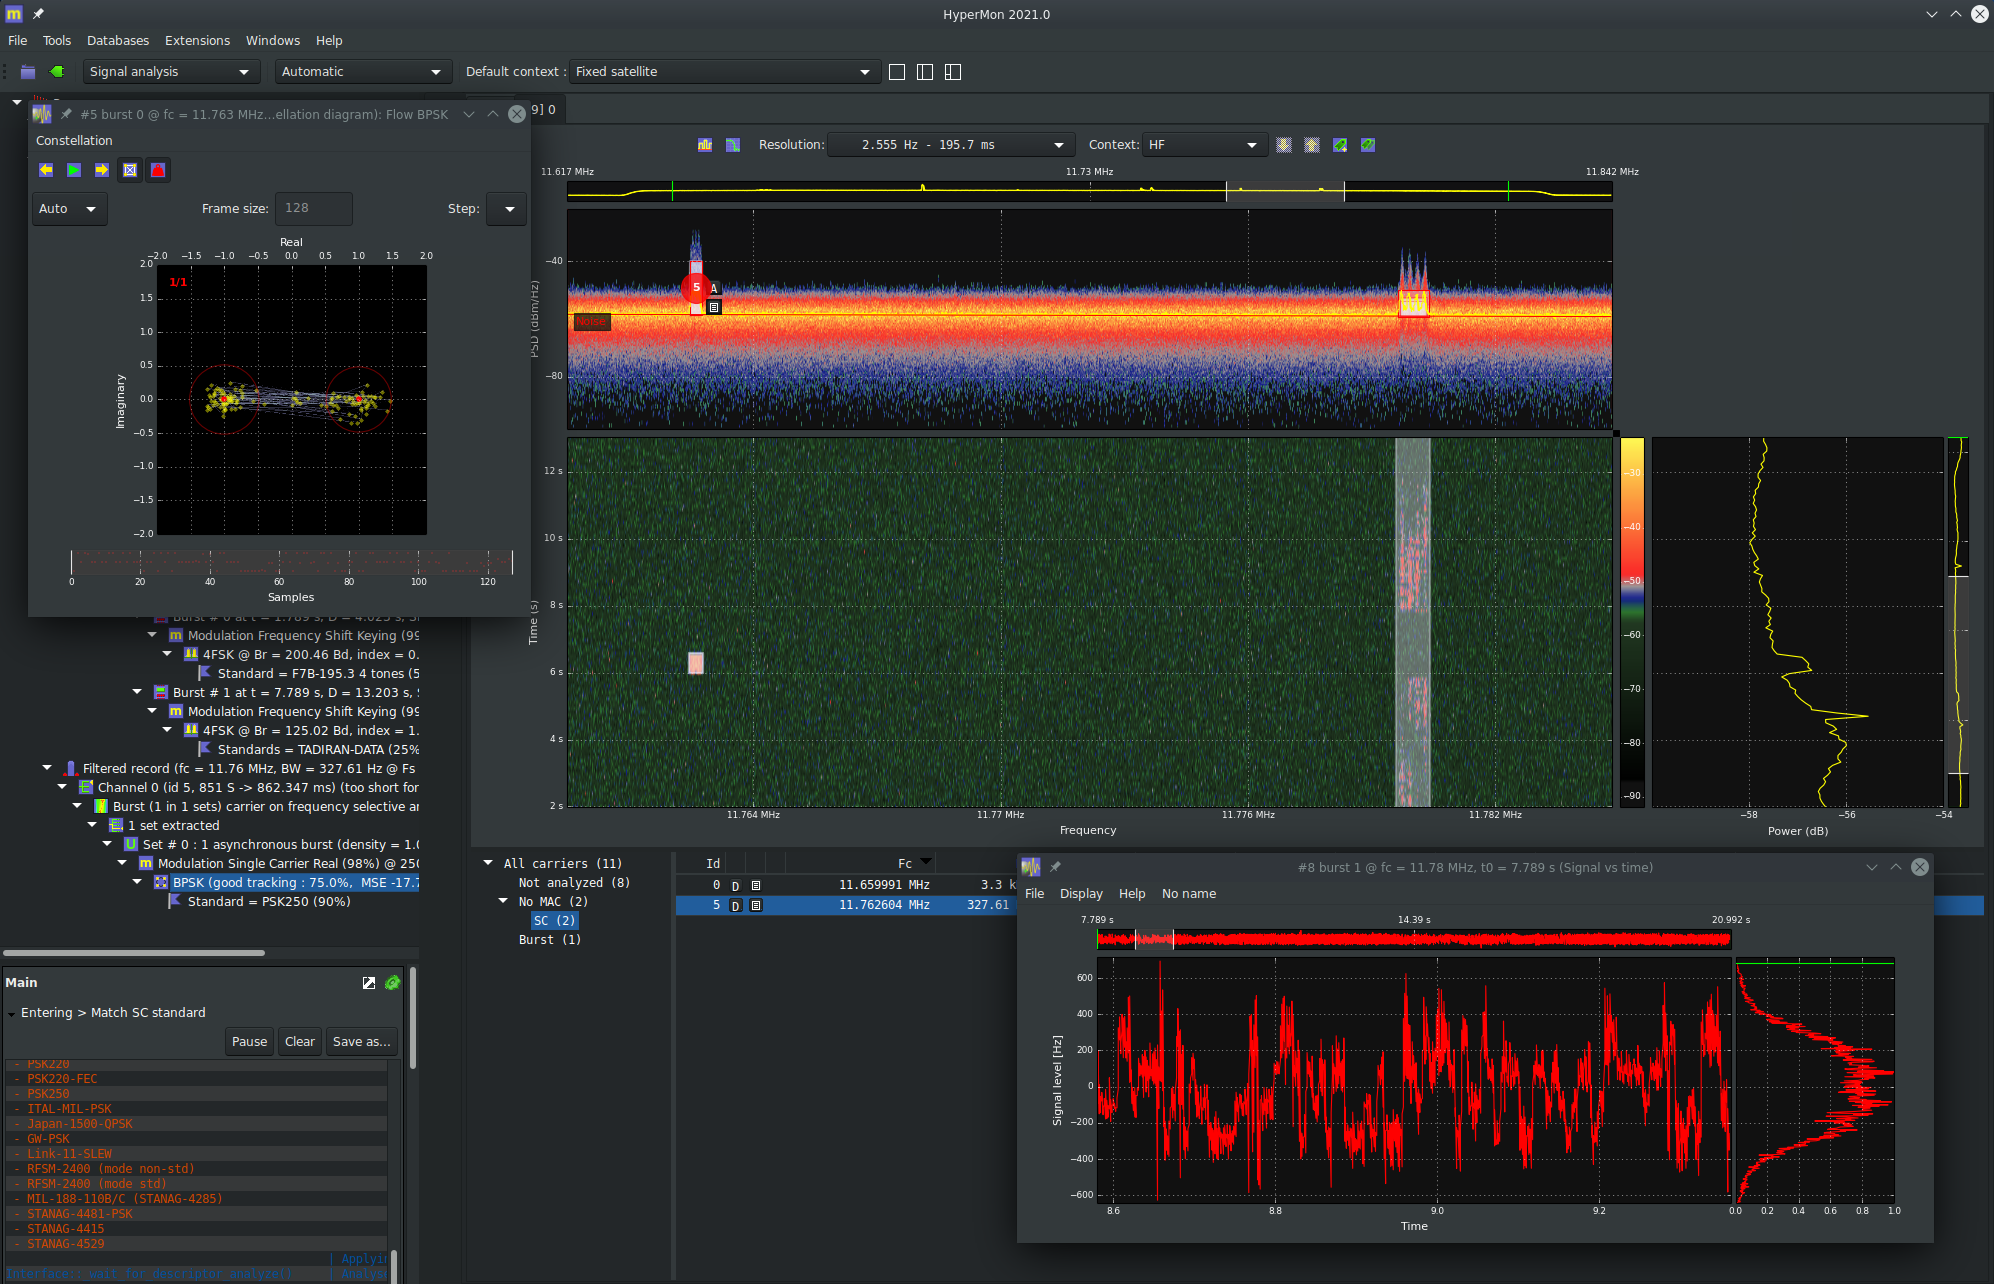
Interception of LPI signals in HF
LPI spectrum display and sonogram illustrates the interception of low probability of intercept signals with a short burst of BPSK and low SNR packet 4FSK in HF band.
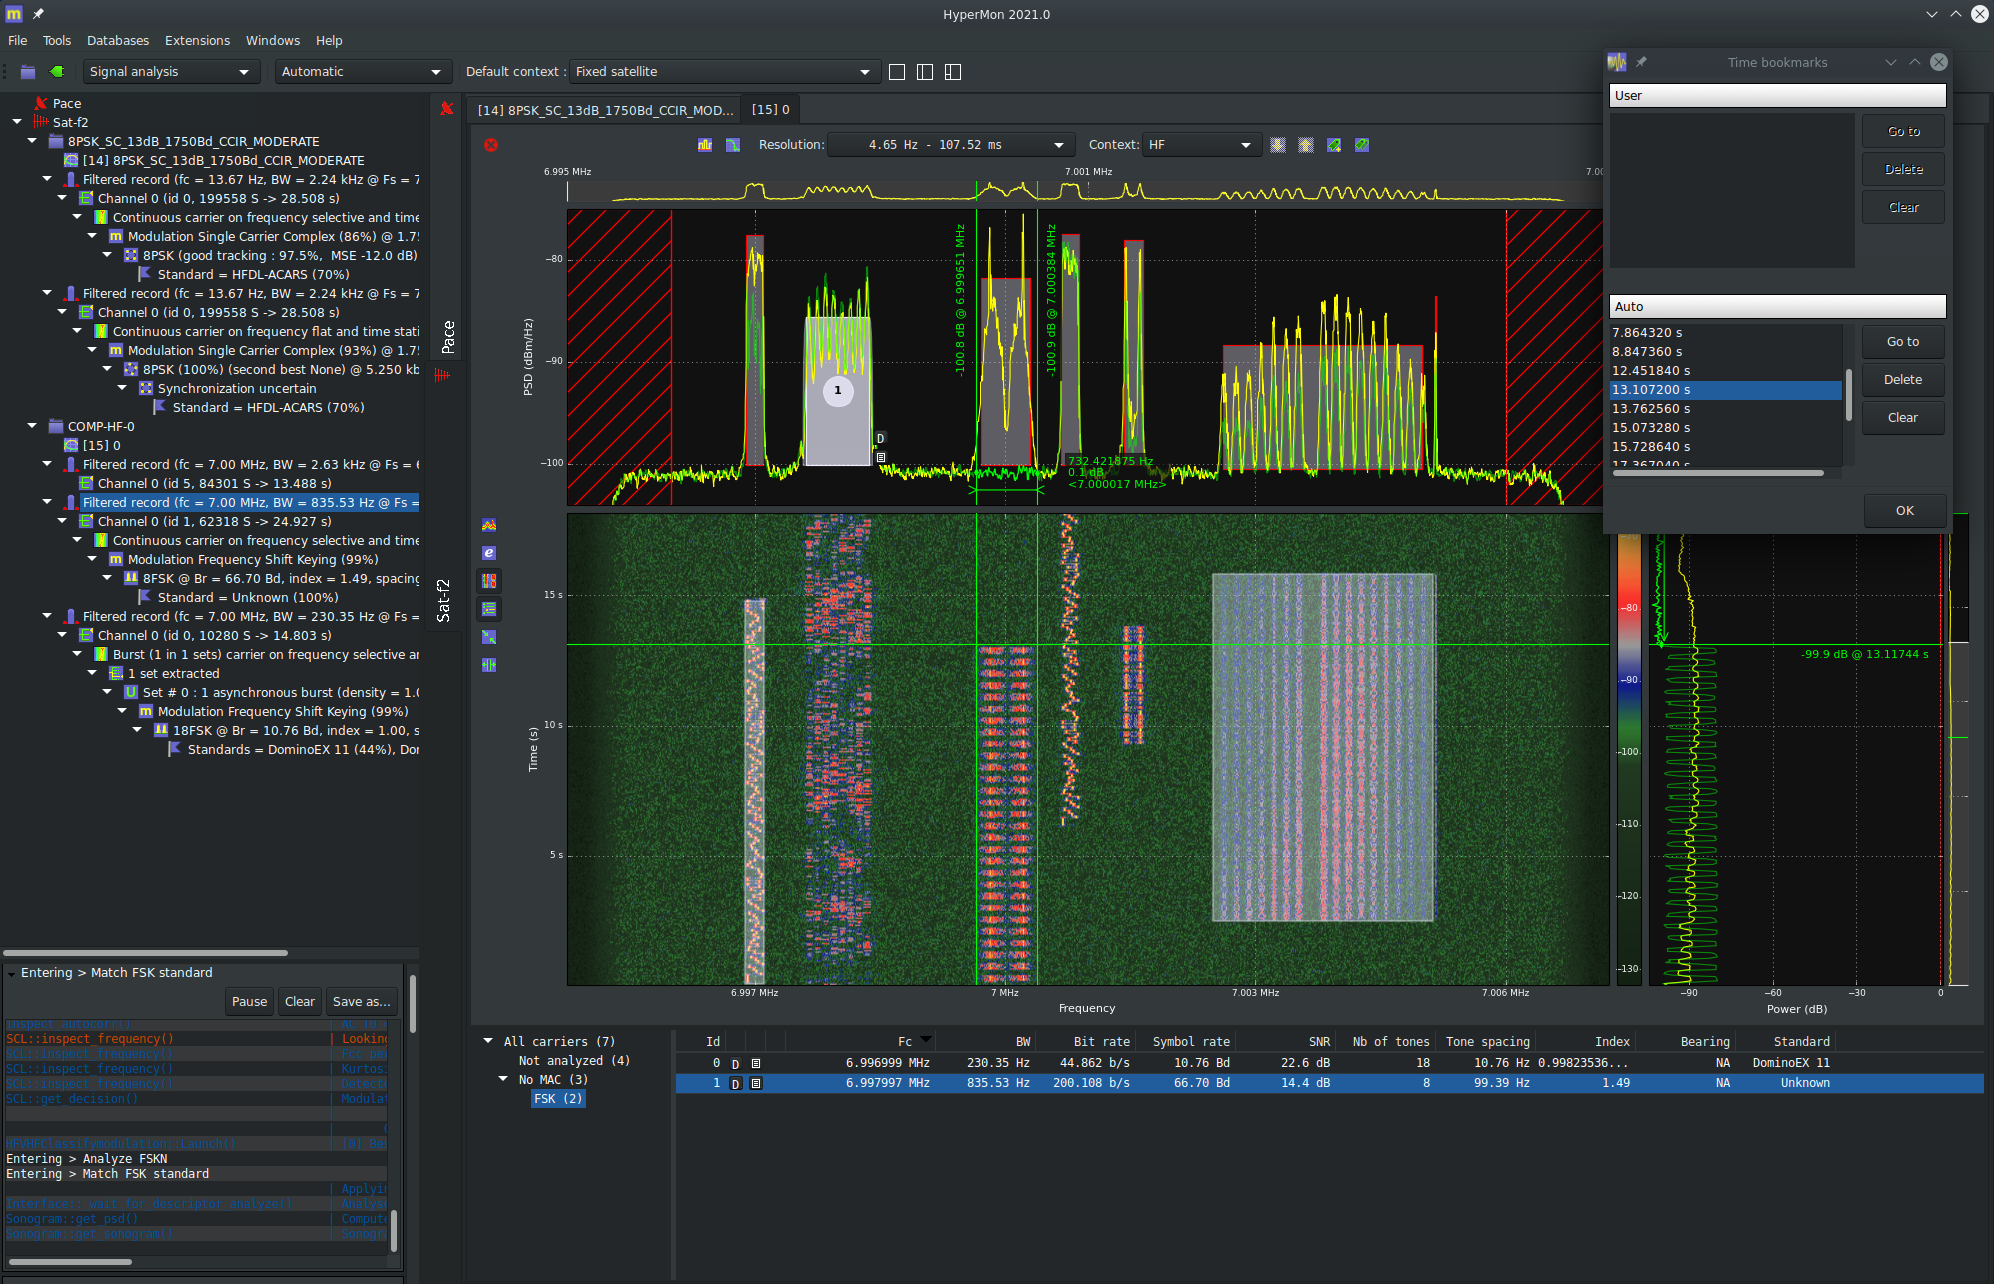
Bookmarks
The special CUSUM detector is able to find any change in multiple carrier broadband signals and generate automatic bookmarks. This is useful when exploring wideband and long recordings. The user can also register his own bookmarks.
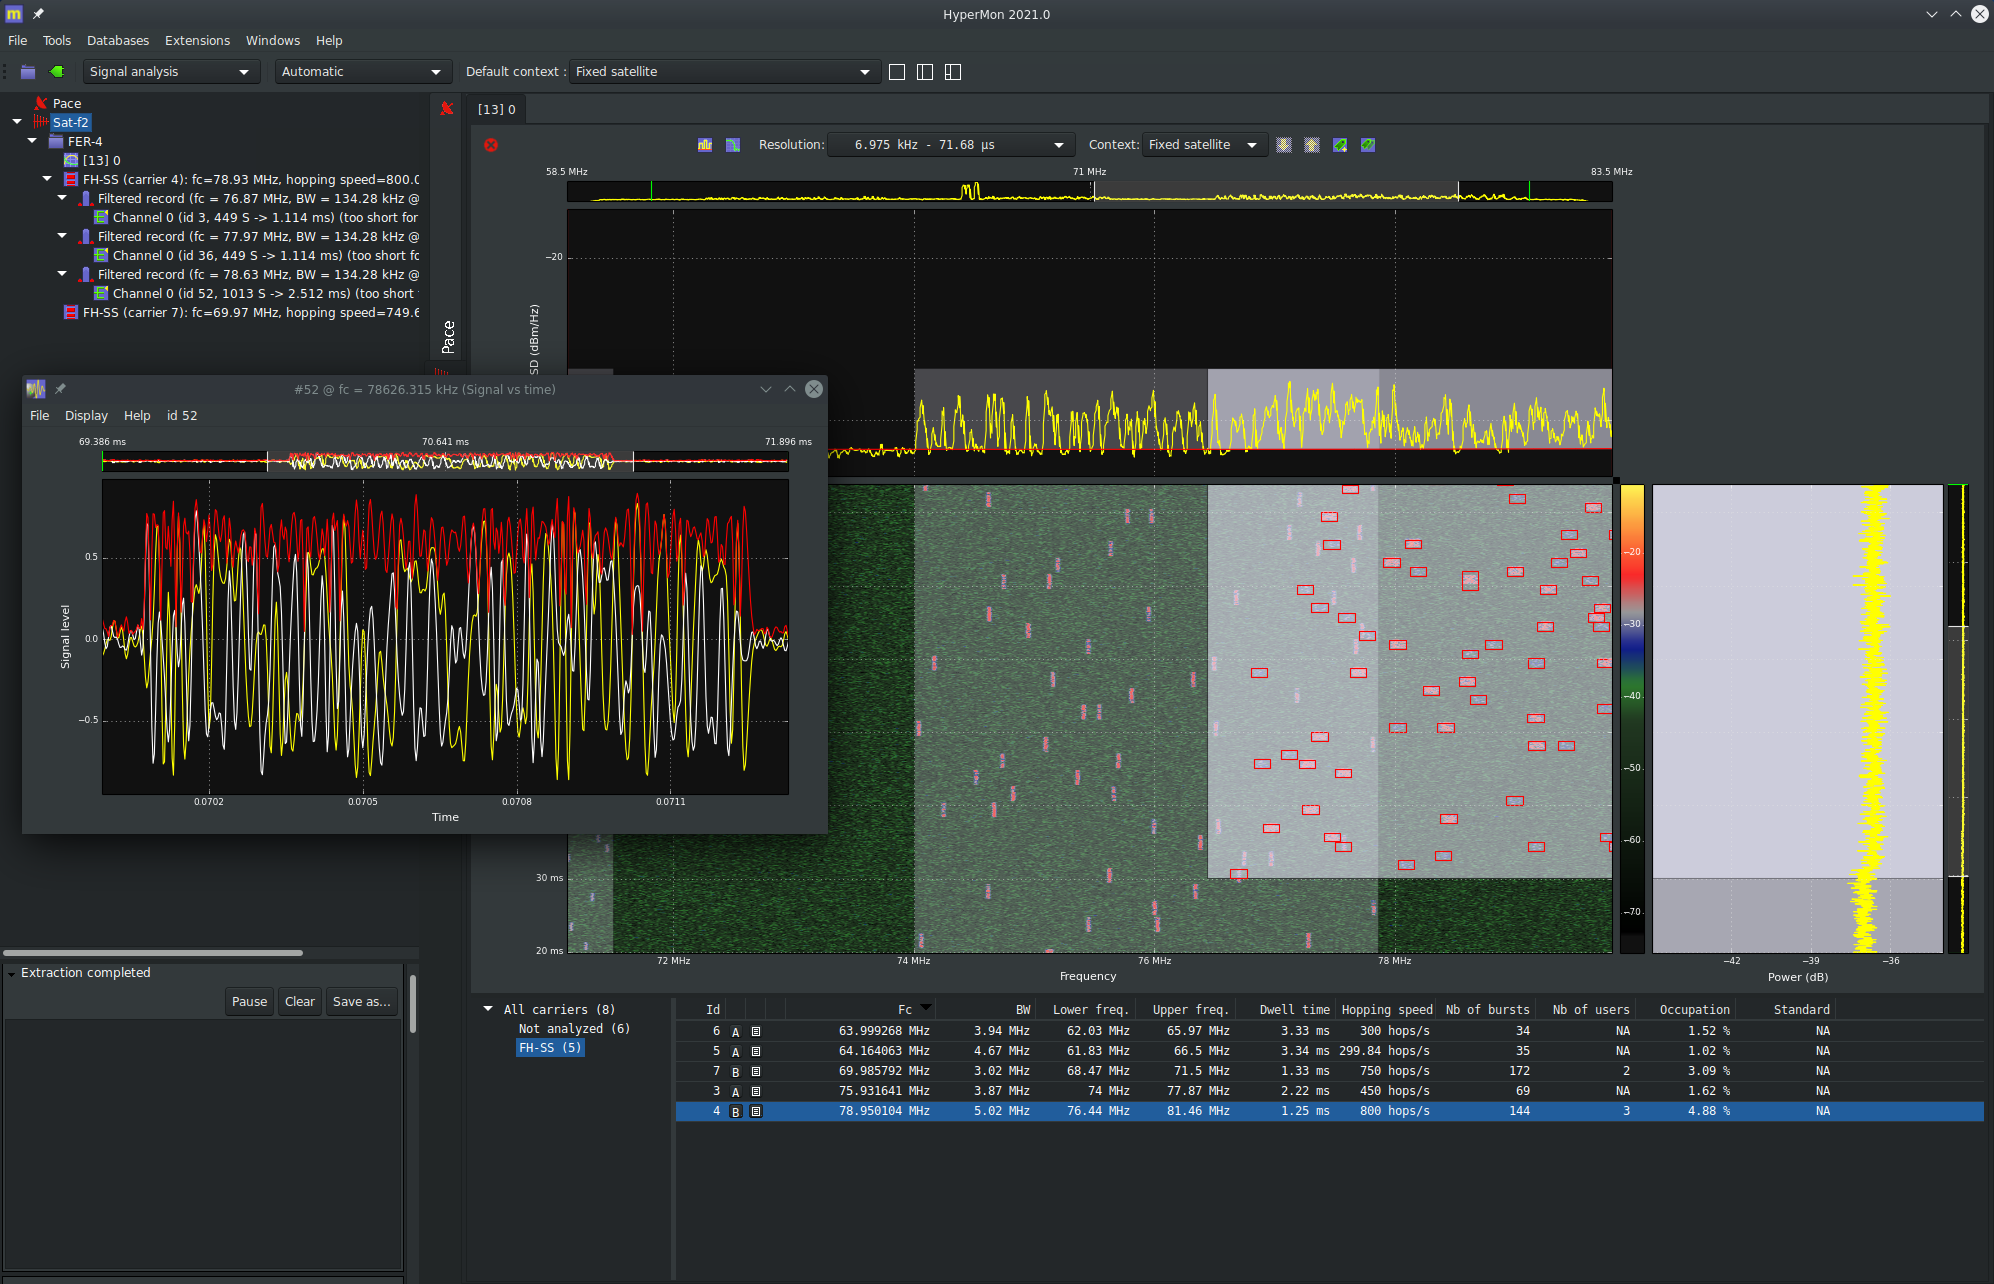
Blind detection of FH-SS networks
Illustrates the advanced feature of Frequency Hopping networks detection and analysis. HyperMon has the capacity to detect such networks, even if they overlap in time or frequency.
×
HyperSpectrum
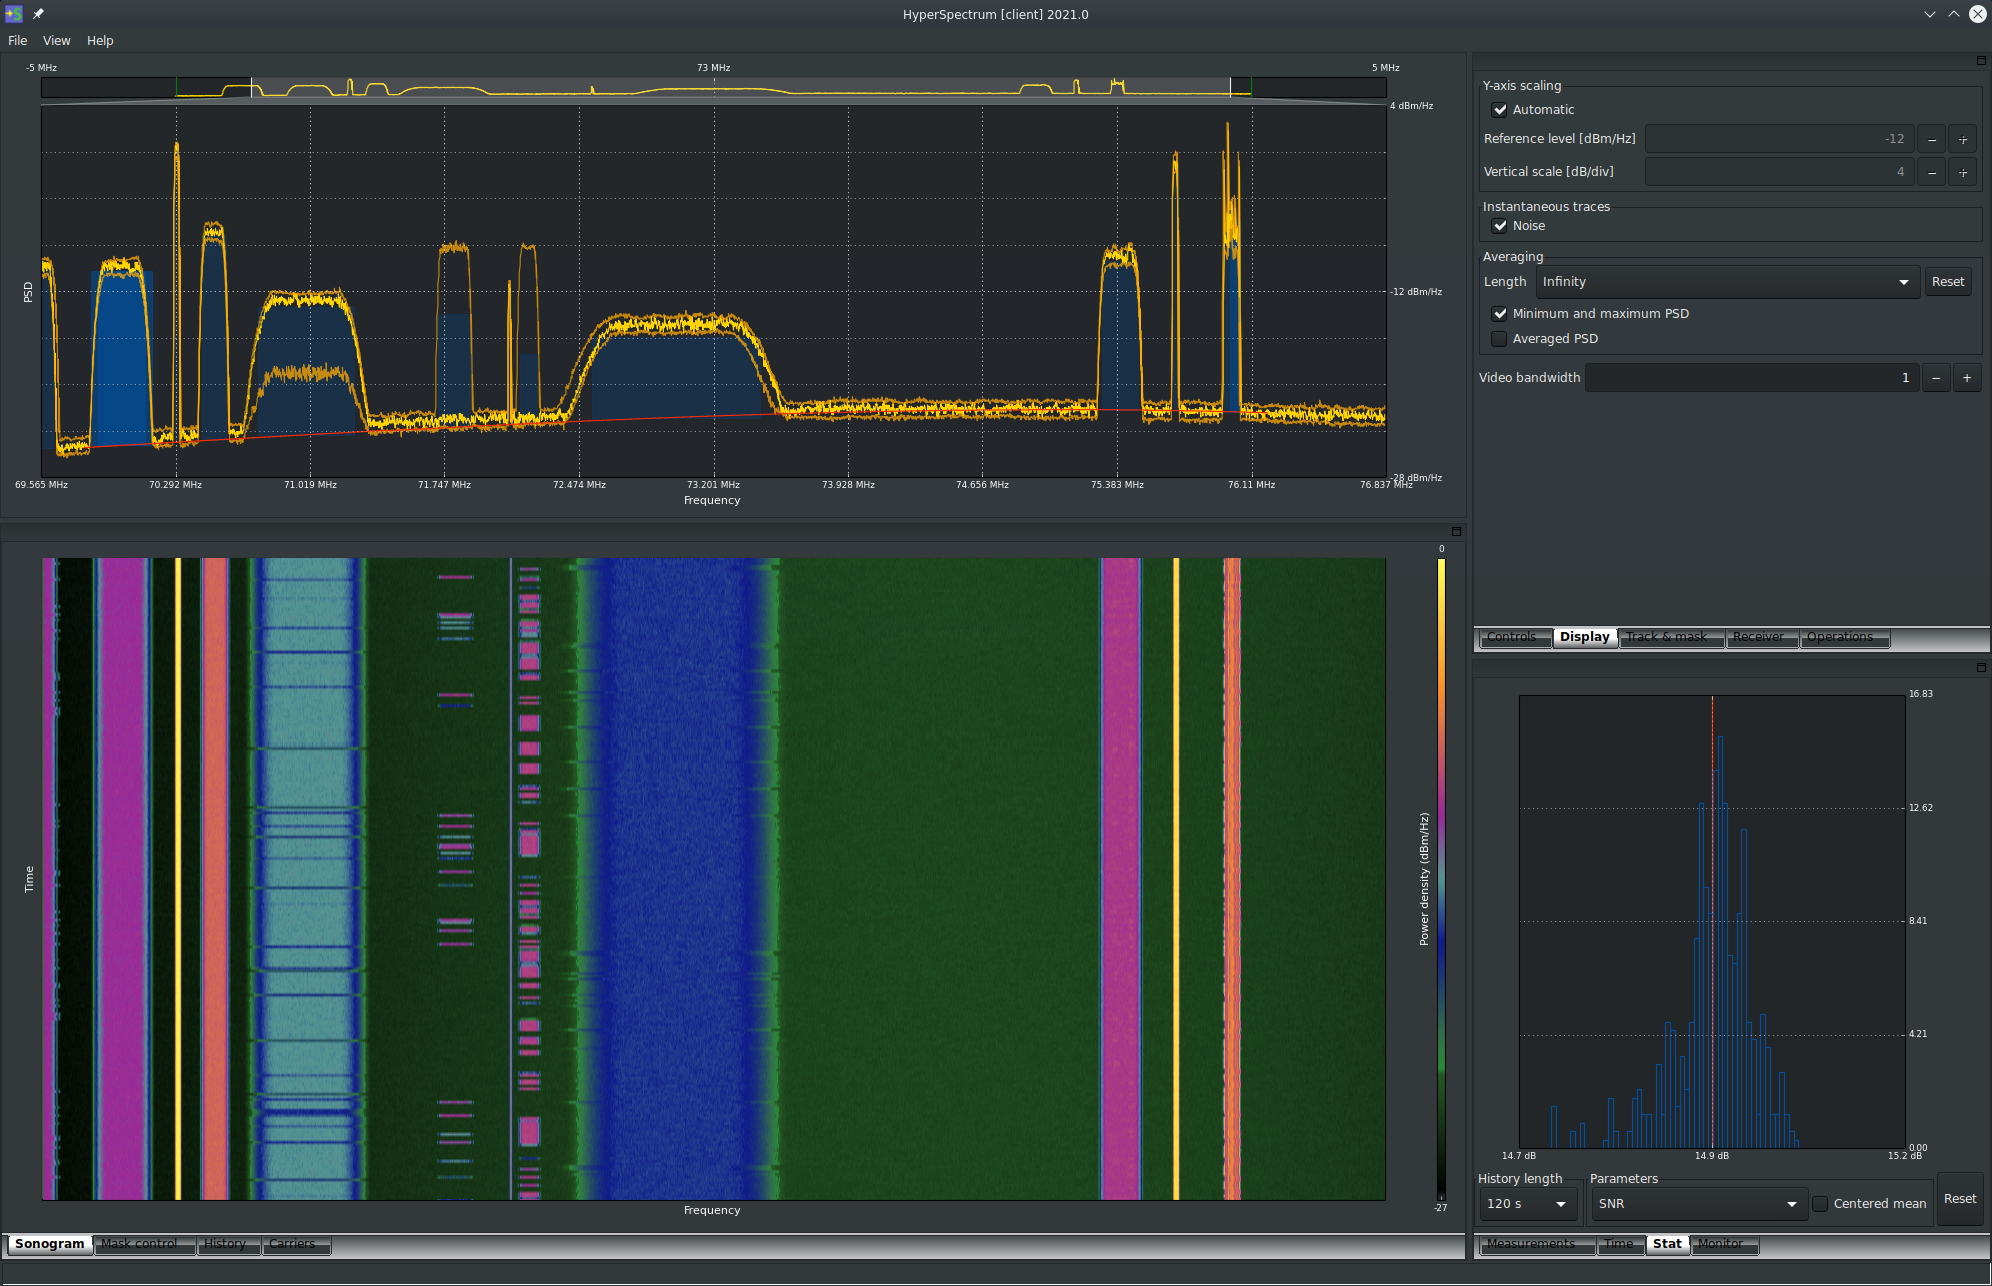
HyperSpectrum basic view
Like any PSA, Hyperspectrum is able to display the spectrum in real-time, but it comes with a carrier detection feature that allows to track the measurements of up to 1000 carriers for hours ! The bottom stats tab displays the distribution of the SNR for the selected carrier over the last 2 minutes.
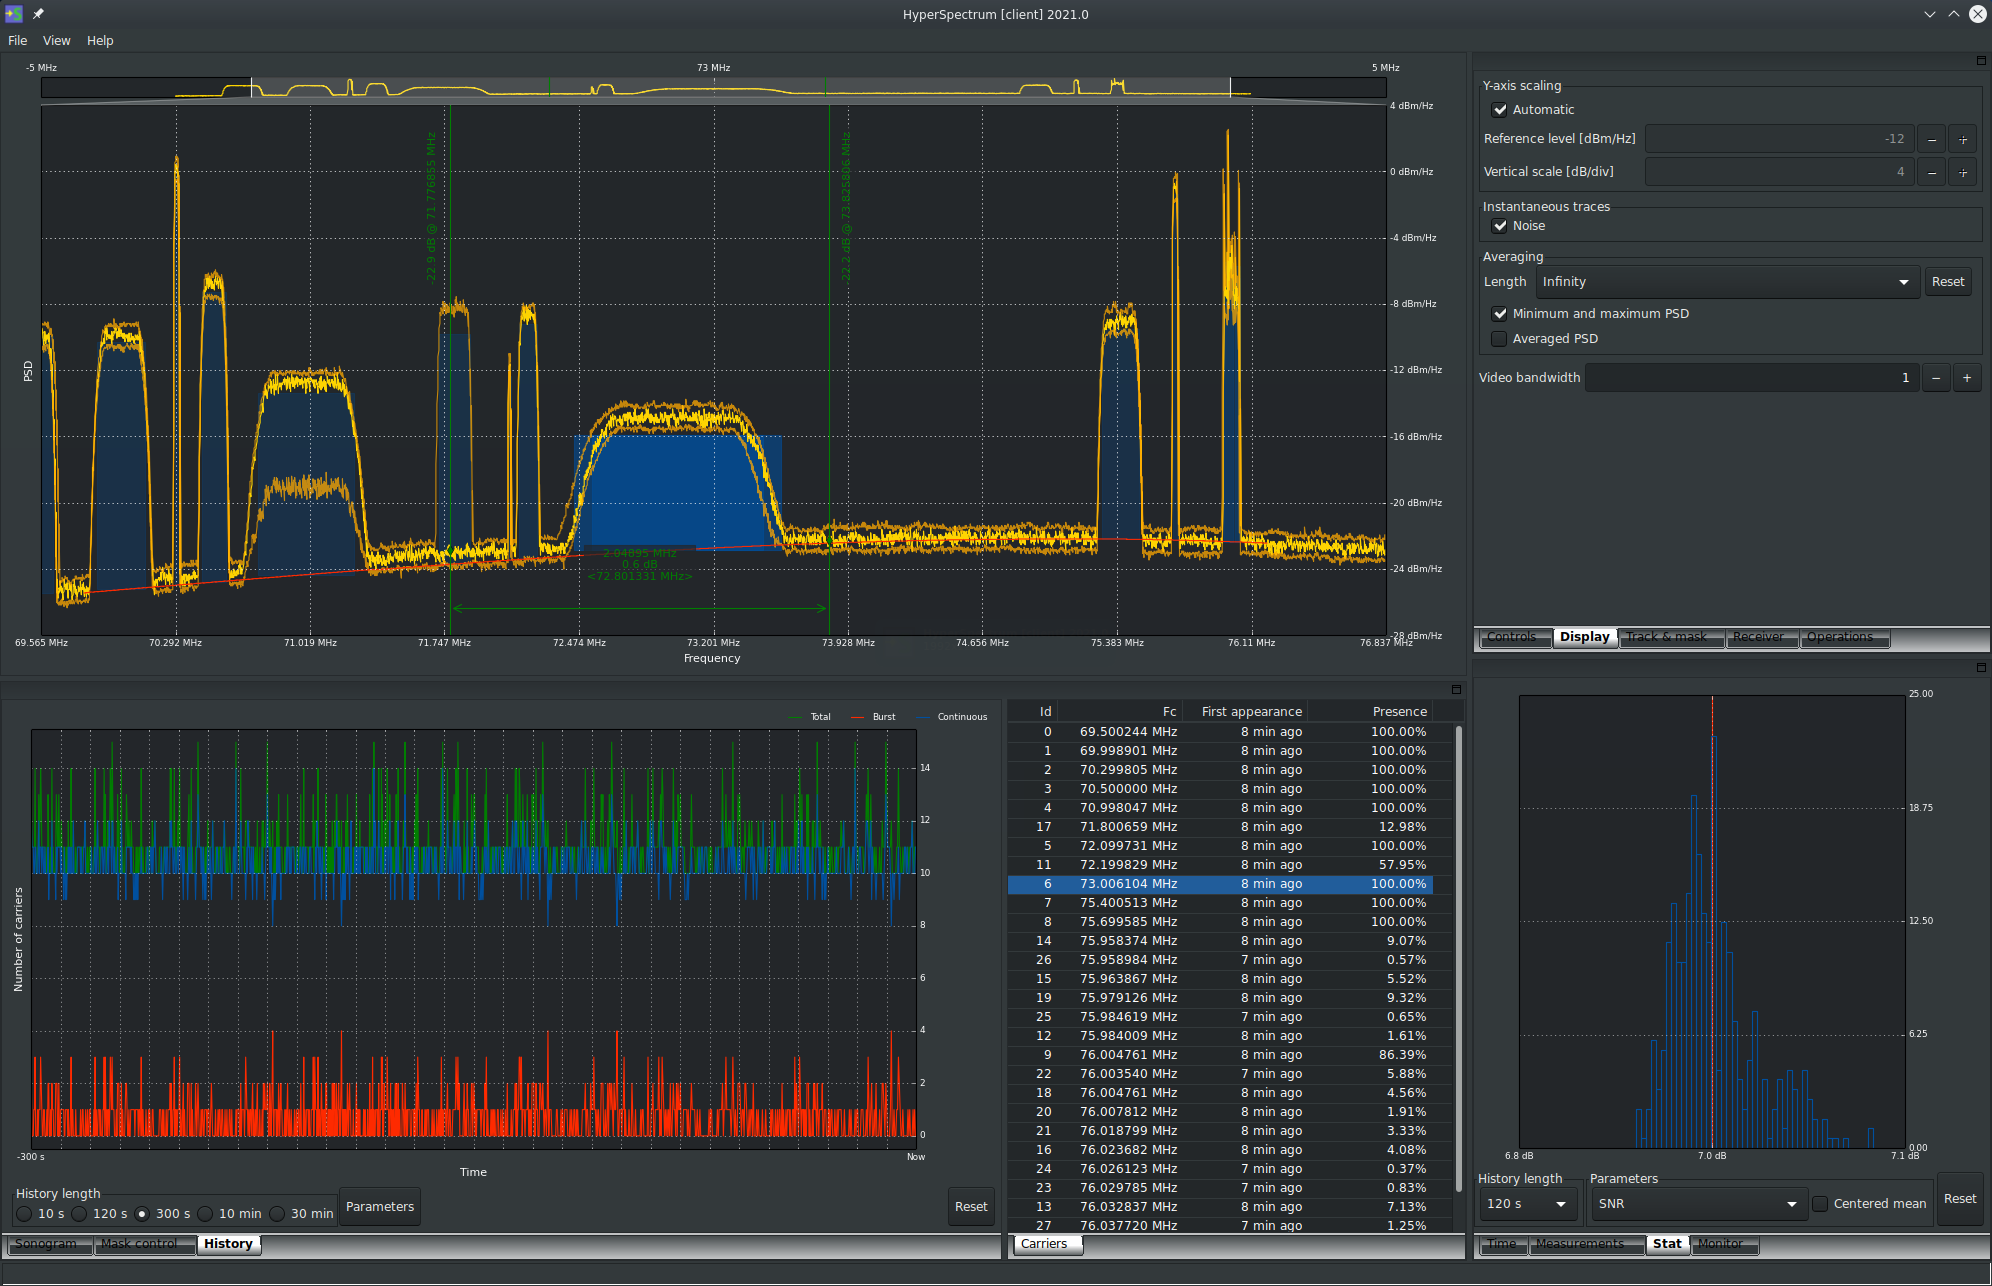
Carrier tracking
Illustrates carrier tracking and presence ratio. Also note that the current spectrum curve is is bracketed by the minimum and maximum observed PSD (both in orange).
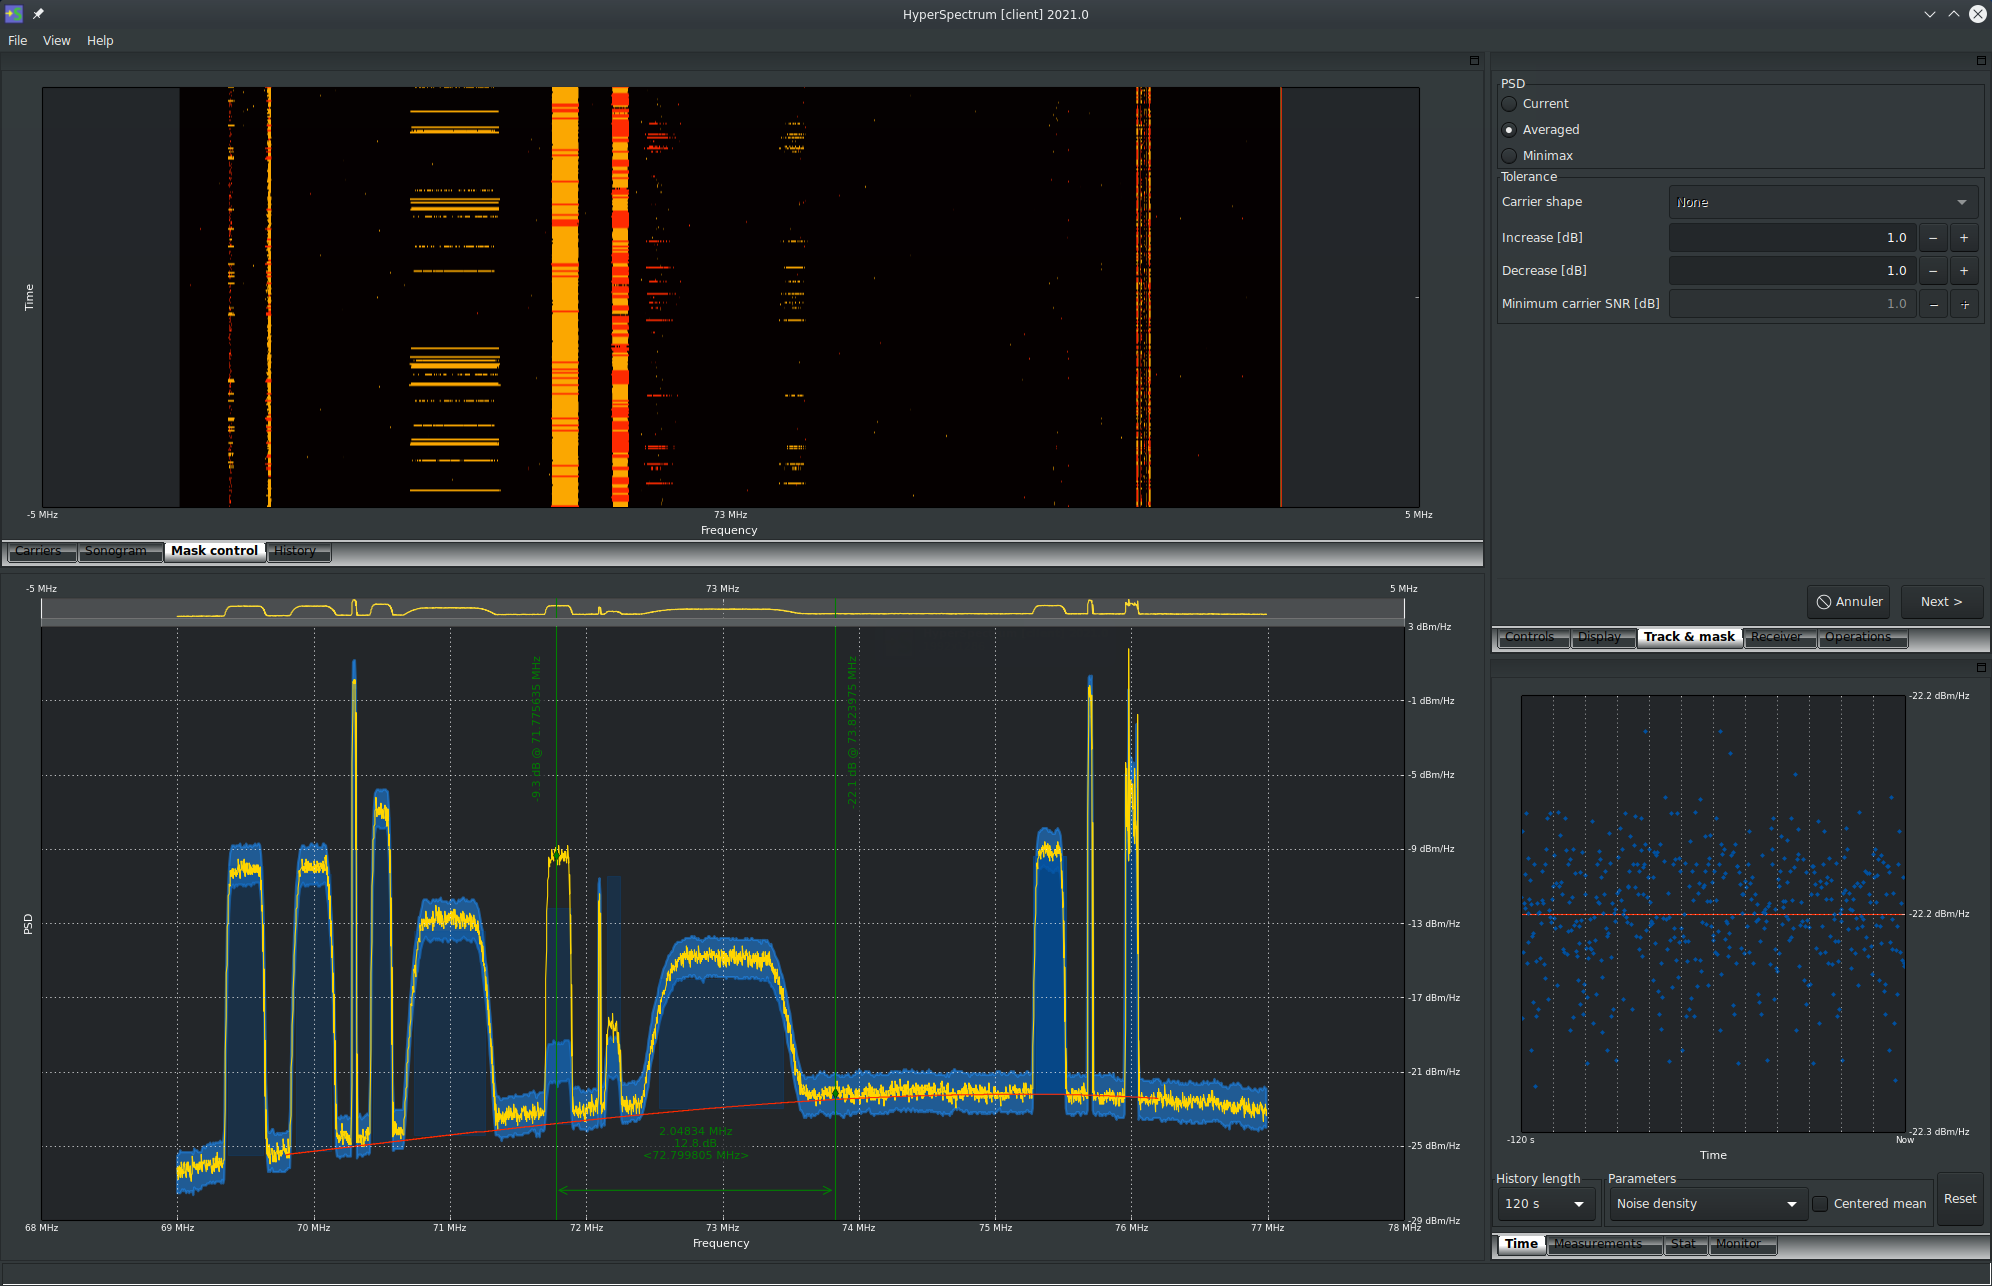
Mask mode
This figure illustrates how you can use the history of measurements to setup a mask (the blue ribbon around the current PSD). Once the mask is activated, any increase or decrease of the PSD is displayed in the Mask Control tab (here above the PSD, with 2 colors only).

Constellation and CuC focus
HyperSpectrum has the ability to connect to HyperMon to perform the analysis of a selected carrier. Once this is done, constellation display and carrier under carrier analysis is performed in real-time ! In this example, an interferer is sweeping under the selected carrier ...
×
HyperStream
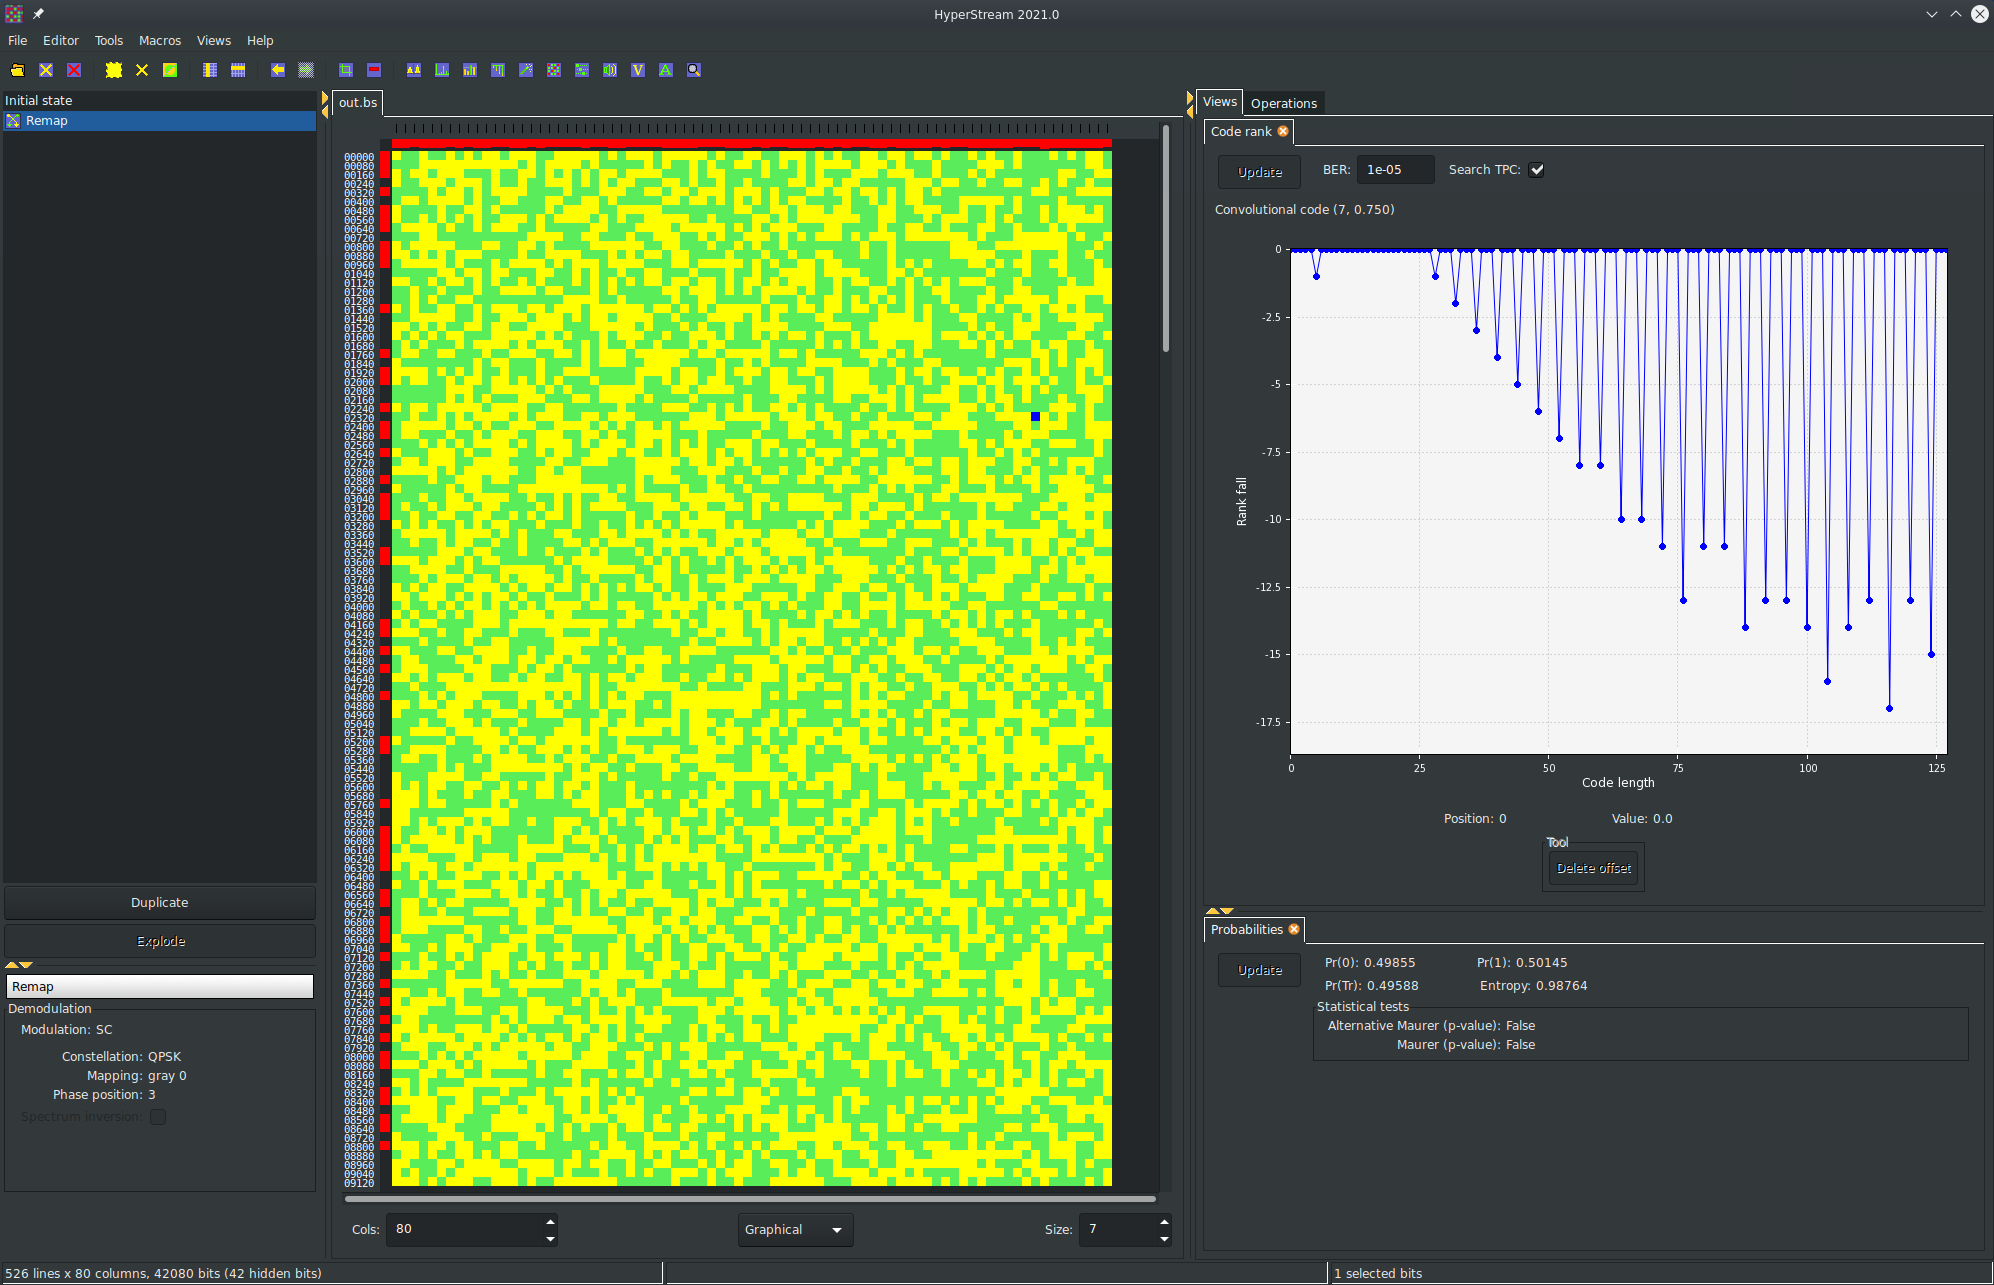
HyperStream FEC detection
Illustrates how HyperStream displays bit streams coming from HyperMon demodulation and demapping. The views set of tabs displays the usual bit probabilities and statistical tests. The upper tab shows the result from the advanced FEC detector with a rate (7, 3/4) punctured convolutional code. The bi-color bit display is setup to show the parities (red on the left) and the weights (red at the top).
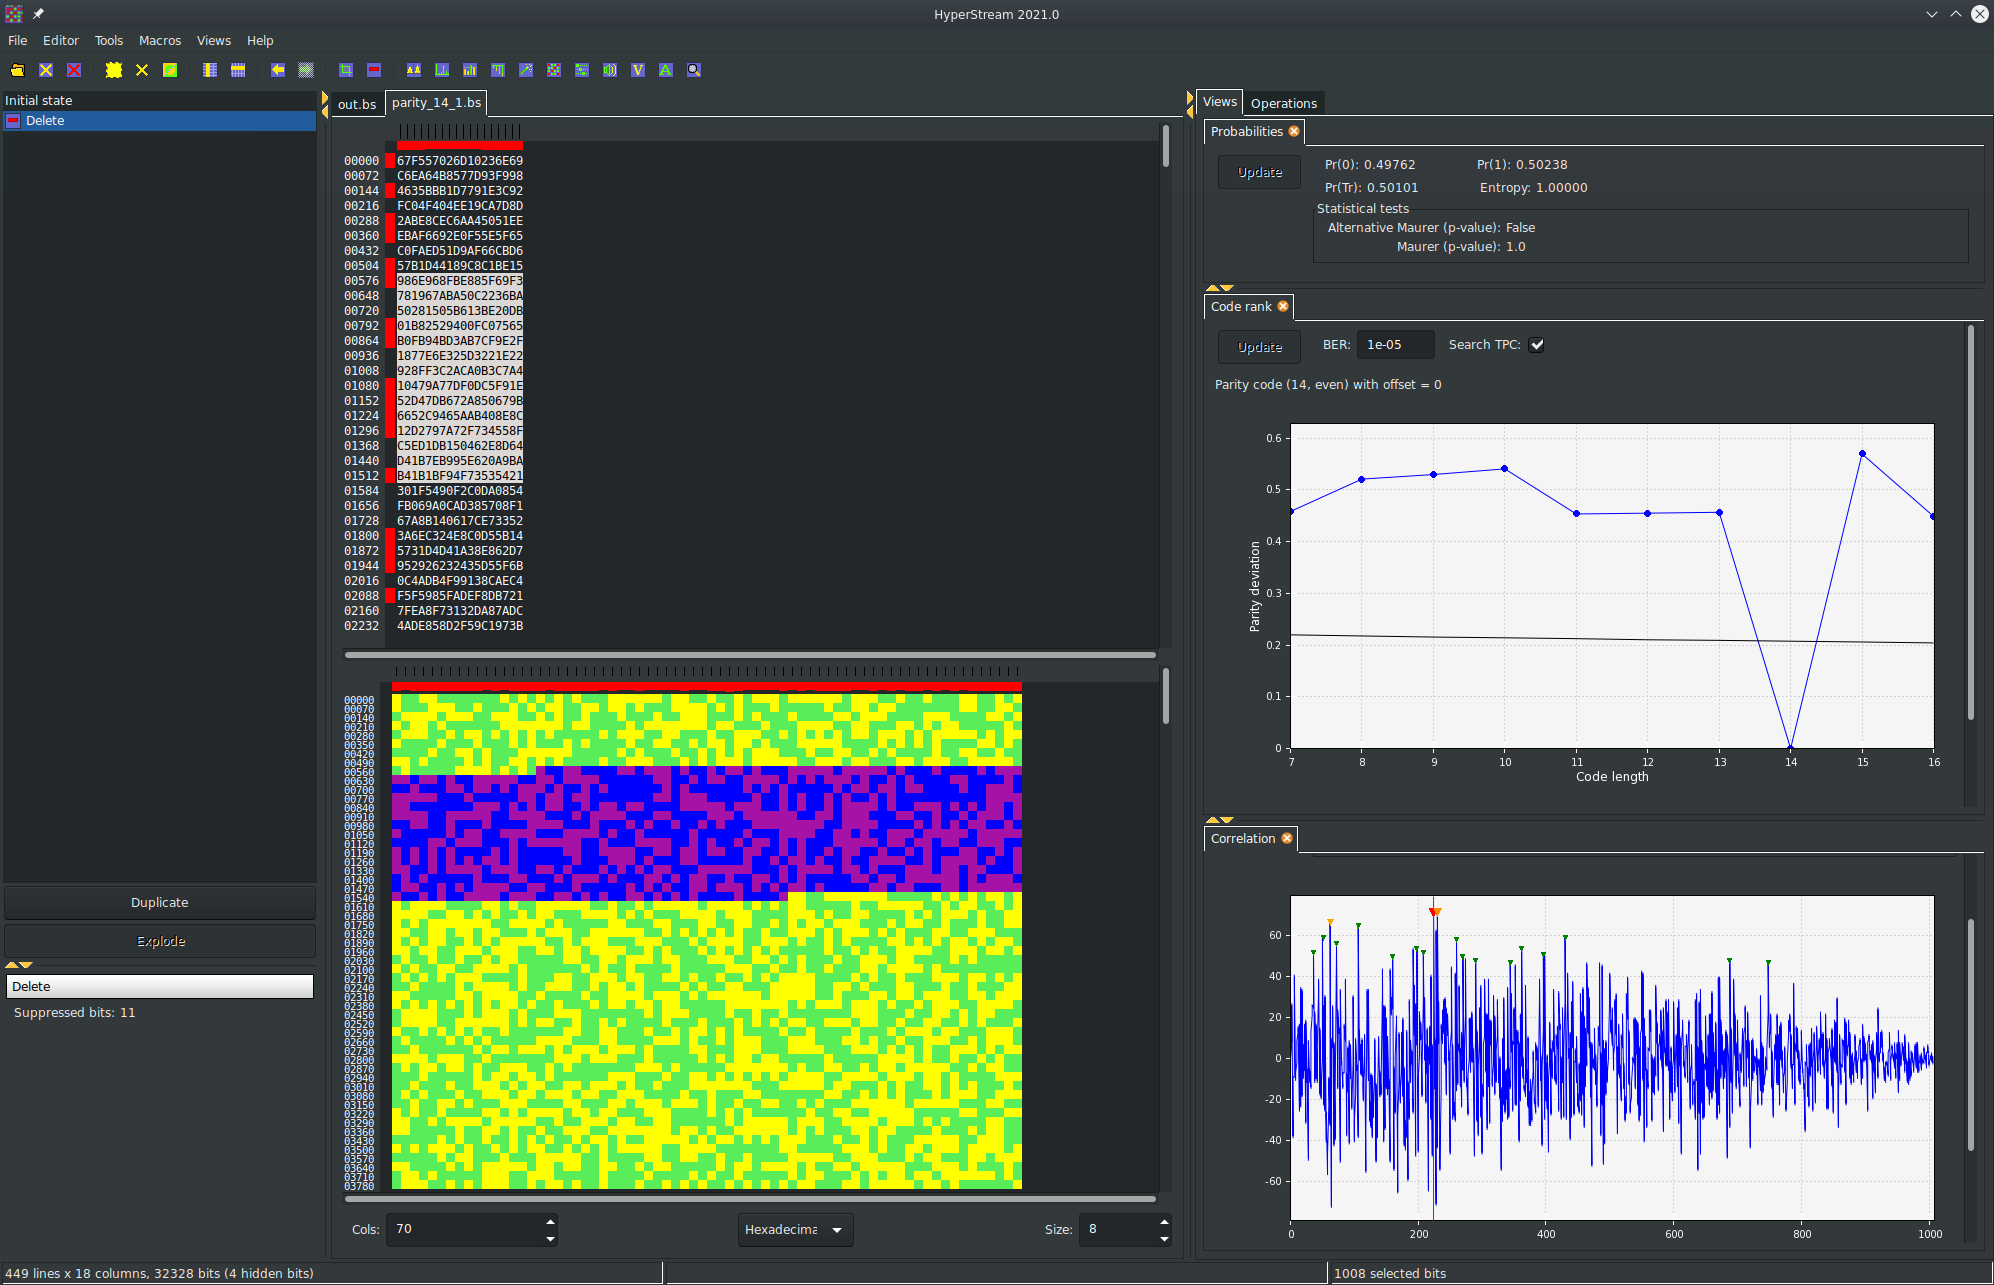
Dual view editor
HyperStream is able to load many bit streams in the same session. For each bit stream, the dual view bit+hexa can be selected, with synchronous selection between views. This screenshot also illustrate the bit autocorrelation view and the detection of a (14, 13, even) parity code.
×
